- The Prime Wave
- Posts
- Distribution Days
Distribution Days
Are investors quietly dumping NVIDIA?

The Prime Wave is a free weekly publication intended for active traders and those interested to learn more about trading. If this has been forwarded to you, you can subscribe here to continue receiving the newsletter.
THE BIG IDEA
Accumulation and distribution. They are two long-ish words but their relevance to the stock market is easy to understand. It’s all about the back-and-forth momentum between buyers and sellers. Their relevance to current trading in NVDA is also especially important now.
This newsletter is not going to go into detail about the concept today. We will give a little background in case you want to explore the subject more on your own.
The first trader to think about accumulation and distribution as we know it today was Richard Wyckoff. He came up with a detailed methodology for understanding the stock market that included 5 steps each for accumulation and distribution. We’ll skip the details, but an important point was that at market bottoms large buyers would start quietly buying (accumulating) shares while the overall market mood was still bearish. And the reverse happens at tops.
Big investors, for some reason, don’t like to reveal their plans ahead of time. However, there are clues that the rest of us can pay attention to.
In a distribution phase, you often see higher trading volume on days the stock is going down compared to when it is going up. This is institutional investors trying to unload some shares without disturbing the market too much.
This is where we are with NVDA. Take a look at the following chart.

The last six days have been: Up-Down-Up-Down-Up-Down.
The trading volume on each Down day was higher than on the Up day that preceded it. In fact, going back to July 28, you see a general pattern of higher volume when the shares are going lower.
And if you take another look at the chart, you will notice that the share price is actually higher now than it was in late July. Putting it all together, the common interpretation is that the larger (and smarter?) investors are distributing (selling) their shares to the less-informed, who are still in a bullish frame of mind.
It is not automatic that NVDA is going to crack. But if you notice the signs of distribution underway, you might decide to stay away for now.
SEEN ON THE INTERNETS
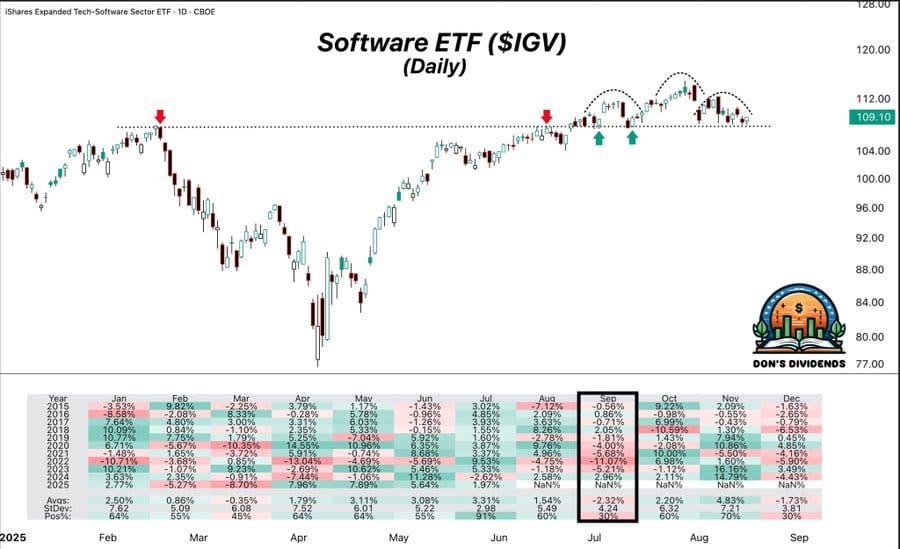
On Friday, this post on social media from Donovan Jackson caught our eye.
Jackson pointed out that software stocks looked “vulnerable”, adding that September has historically been a weak month for these stocks. There is no particular reason for the seasonal weakness, but the results are what they are.

The chart features the infamous “head and shoulders” chart pattern. It is a bearish development, but has a checkered history of predictive value. Jackson himself questioned whether the pattern might fail again.
We agree with him that software stocks will be interesting to observe in the coming days.
NUMBERS ONLY
- 0.92% | The Dow Jones Utility Average is literally the only well-known index that went down last week. |
46.2% | Despite stocks being at/near highs, 46.2% of individual investors are bearish, according to AAII. |
- 7.04% | Even after a recent rally, shares of Apple (AAPL) are still down more than 7% YTD. |
SWINGEX INDEX
As of market close on: 15 August 2025
 |  |
Swingy says: After a few negative days, the index is back to zero. Meh. This is what you people call the dog days of summer.
See some historical examples of the Swingex Index in action here.
WATCHER
Stocks highlighted here each week are not recommendations to buy or sell. They are provided as ideas for swing traders to follow up on with their own research.

Centene (CNC): It is an ugly chart. There is no getting around that. The last few days have given us something to work with, though. Aside from getting a boost from positive developments among other healthcare stocks, there is an emerging pattern of higher volume on up days compared to down days. It could run some more, but we would look for a “red to green” situation where the shares briefly head lower and then turn around.