- The Prime Wave
- Posts
- Thrusting Frenzy

This is the weekly version of Market Sparks. Here you will find items of general interest to active stock market traders. The weekly is free for all subscribers, alerts during the week are reserved for paid subscribers only.
THE BIG IDEA
There has been alot of buzz the last few days about something called the Zweig Breadth Thrust. It has been cited on social media, referenced in news articles, even Matt Miller, co-host of Open Interest on Bloomberg TV could not stop raving about it on Friday.
I have found that most bona fide Breadth Thrusts aren’t preceded by a lot of Breadth Thrust chatter…
- Walter Deemer on X/Twitter April 24, 2025
But how many people actually know how it works and how it is calculated? And what about some other “breadth thrust” indicators? Let’s review it all today.
There are two common threads among the most popular variations of “breadth thrust” indicators:
1) They involve Advance-Decline data. That’s the whole point of ‘breadth’.
2) They are based on NYSE data.
But let’s start with Martin Zweig. His recipe starts with the percent of advancing stocks on the NYSE each day and then calculates a 10-day moving average of that stream of figures. A breadth thrust signal is generated when that moving average travels from below 40% to above 61.5% within ten days.
For this signal to be triggered, you need a period where the number of declining stocks overwhelms advancing stocks, and then for the opposite to happen immediately after. It happens rarely, however it has reliably preceded solid gains for the stock market.
Walter Deemer took a slightly different approach with what he called Breakaway Momentum, which many people refer to as a breadth thrust indicator. His calculation begins with the number of daily advances and declines on the NYSE. Then you keep a running 10 day sum of both numbers. As a last step, you calculate the ratio of those two 10 day sums. When the ratio is more than 1.97 then the indicator is triggered and portends a higher stock market. Why precisely 1.97? Probably because there were several near-misses of 2. And there is nothing special about exactly 2 anyway, so 1.97 it is.
Unlike the Zweig Breadth Thrust, this definition does not depend on what happened before the 10 day period. It still requires two weeks with an average of (almost) twice as many stocks going up than down each day. To get there, Deemer emphasized that “the real trick in achieving breakaway momentum is to keep declines limited during the inevitable corrections that occur in any ten-day period”.
And then there is the Advance Decline Thrust indicator created by Wayne Whaley. He received the Charles H. Dow Award in 2010 for his research into breadth thrust indicators. It is popularly known today as the Whaley Breadth Thrust. In contrast to Zweig and Deemer, Whaley reduces the lookback period to 5 days but requires a higher mix of advances to declines.
He found that outsized future gains in the S&P 500 occurred when the ratio of 5 days of advances to 5 days of advances + declines on the NYSE is more than 70%. It is not clear, it has to be said, why he used NYSE data for advances and declines, but the S&P 500 for historical returns.
Others have made their own breadth thrust indicators, and they may work even better than these more well-known versions. There is something called a “Super Zweig”, which is a variation on the original Zweig indicator. You might even build your own by tweaking the typical parameters.
Whether a “breadth thrust” happened last week, or not, depends on which definition you prefer and, importantly, which collection of stocks you use. The original concept of a breadth thrust came about back when the NYSE was the only place to be. Should we just use stocks in the S&P 500 if we are going to use that as our reference for outcomes? Or the S&P 1500, as some people prefer?
In the end, the main takeaway from all of this is that a cluster of days with many more advancers than decliners typically leads to further long-term gains in the stock market.
SEEN ON THE INTERNETS
As a counterpoint to all the thrusting chatter, there is this piece of sobering analysis from Steve Deppe, CMT. He looked at other years when the YTD return for $SPX ( ▲ 0.32% ) was down 5% or more at the end of April and what that suggested for the future.
You can see that except for the COVID Spring of 2020, when helicopter money was thrown into the market, there has not been a good outcome for 50 years. If the trend is down at this point, it is likely to continue down for a while longer.
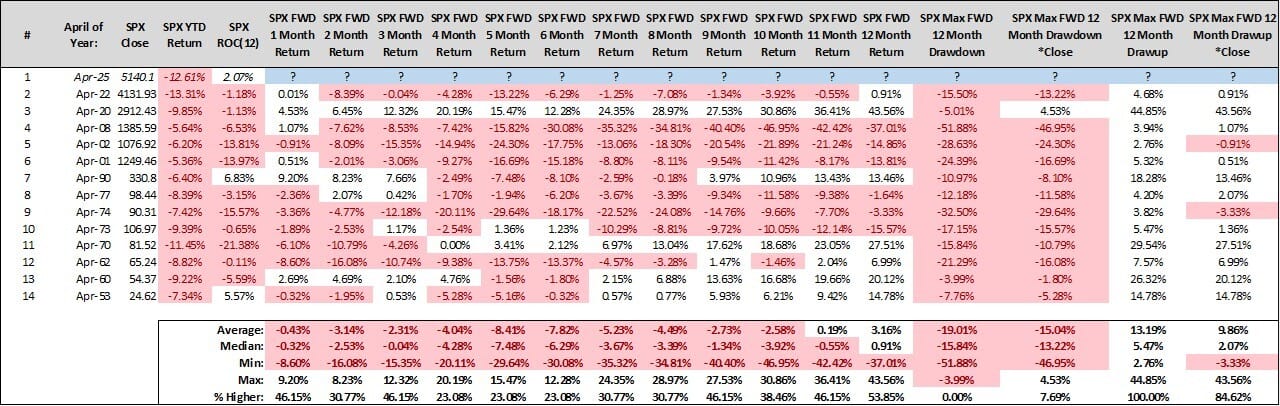
This was posted earlier last week, before thoughts turned to breadth thrusts. SPX is still down 6% for the year, though. Keep this in mind as we play out the last few days of the month and head into the traditionally softer six months of the year.
NUMBERS ONLY
353.1 | The current value of the McClellan Oscillator. The last time it was this high was July 16 of last year. |
81.3% | The percentage of respondents to an AAII survey who said they have become either more bearish or more cautious since the start of the year. |
0 | Number of days since the April 2 announcement on U.S. tariffs that $SPX ( ▲ 0.32% ) has been above its current level. |
SWINGEX INDEX
Swingy says: The market has been moving like a cat on roller skates this month, but now the index is exactly neutral. | As of market close on 25 April 2025 0 |  |
See some historical examples of the Swingex Index in action here.
REWIND
A look back to 2-3 weeks ago to see how our Alerts have played out.
We offered two ideas amongst the daily whiplash of tariffs or no tariffs. The market has rebounded well since then, but that was not obvious at the time. We were looking for stocks that would not hurt us much if the market rolled over.
$TTWO ( ▲ 0.43% ) - We alerted this one pre-market on April 11. It opened a little below $205 that day. What we liked was that it’s previous base had held well as support and was showing good relative strength. Take Two closed last week at $225 so we will count this as a win.
$BSX ( ▼ 0.28% ) - We mentioned Boston Scientific on the same day and largely for the same reason. It opened that morning at $93 and is now just short of $102. The stock benefited from an earnings related gap up on April 23rd.
As a point of reference, the S&P 500 is up 5.1% during the same time period.
Sign up for Alerts for $5/month or $36/year